
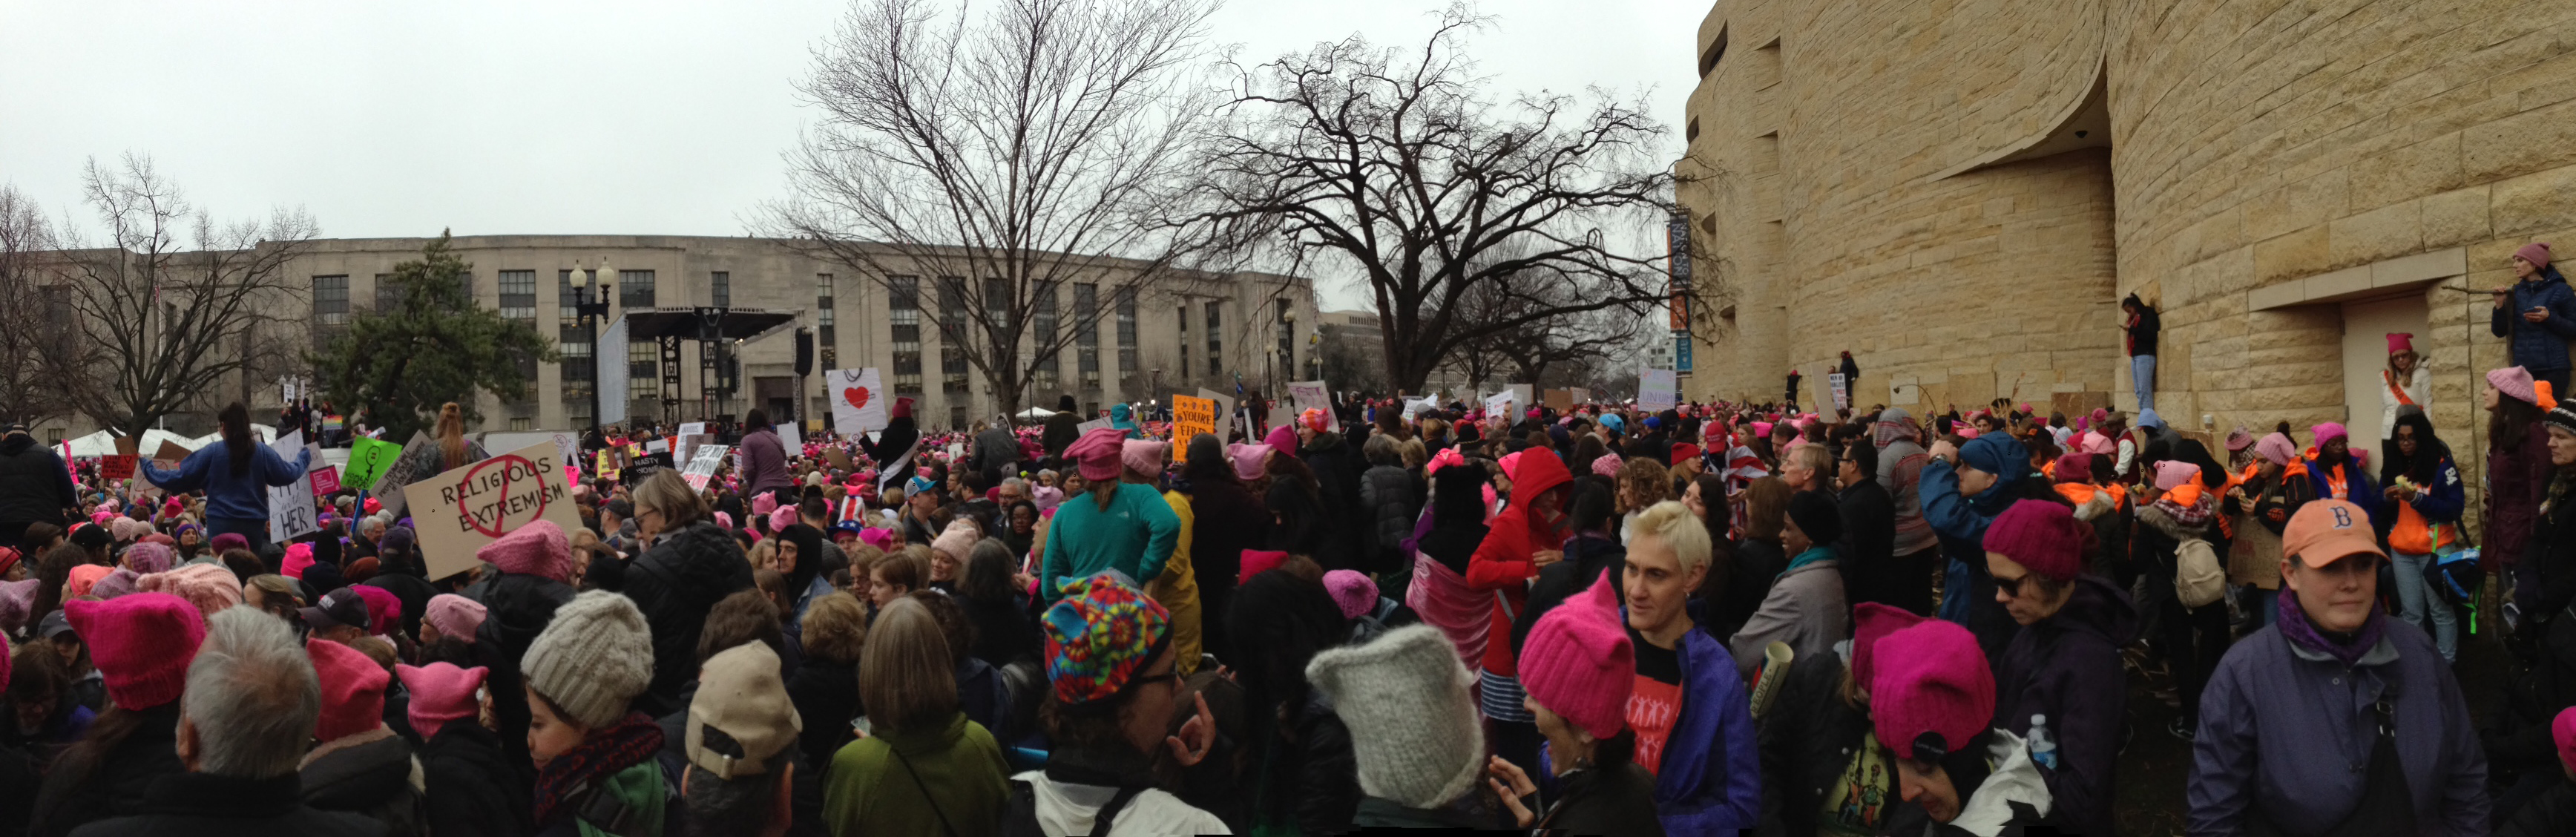
A wide range of people participated in the Women’s March on Jan. 21 in Washington, D.C. (Photo credit: Lee Ann Banaszak, Penn State)
Lee Ann Banaszak | Professor and Head of the Department of Political Science
Popular history says Woodrow Wilson in 1913 asked “Where are all the people?” when he arrived in Washington D.C. the day before his first inauguration. He was told they were all across town watching the women’s march.
In 2017, Donald Trump preferred to refute that there was anything going on. But pictures from the EarthCam, bus permits and Washington Metro ridership information all show that the Women’s March in D.C. was one of the largest ever. Protests in Chicago, Boston, New York City, Los Angeles and California, as well as internationally, indicated that this day may be the single largest coordinated protest in American history.

Lee Ann Banaszak
What can we learn from the Women’s March? First, the march began not from existing organizations but from the spread of discontent through electronic media. That so much discontent was mobilized outside of political parties and across such a wide array of specific interests clearly suggests that there is a powerful but yet untapped political power.
That these same people were not visible in the election suggests that the Democratic party requires change to mobilize its base. The marchers were a wide coalition of working class women, LGBT activists, supporters of reproductive rights, first generation citizens, immigrants, advocates of the Black Lives Matter movement and many more. This is a broad-based coalition more like a political party than a single interest group, but unlike the Tea Party movement, its focus is not on the existing political parties.
One day of protest — while a strong indicator of discontent — is not the long-term organizational force needed to make a difference in electoral politics. But research I’ve done with others shows that public opinion generally can be changed by public protest, and that even those who simply live in countries where there are frequent protests are mobilized to participate.
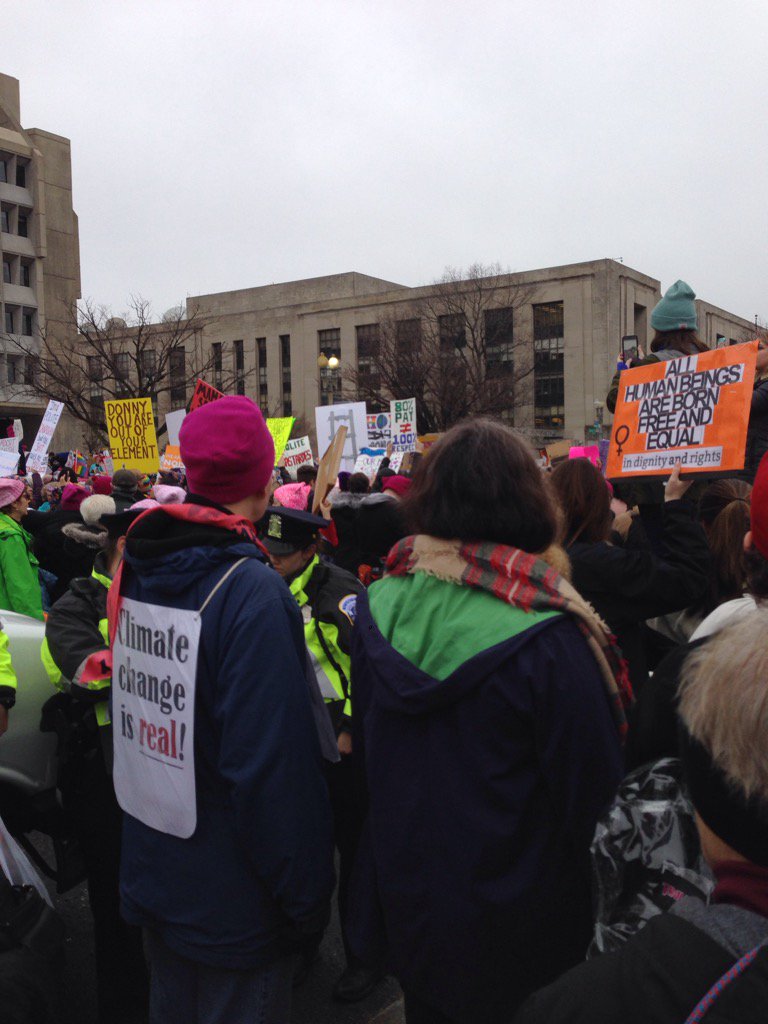
A wide range of people participated in the Women’s March on Jan. 21 in Washington, D.C. (Photo credit: Lee Ann Banaszak, Penn State)
Other researchers have shown that a protest like this is not the end of a chain of action — it is often the beginning. Attendees see that they are not alone and meet and continue to organize. Indeed, protest participants move on to become lifelong activists often returning to organize in local communities for years after the event that initially mobilized them.
Finally, even those who don’t attend such highly visible protests realize that action is possible and are mobilized to act.
All of this suggests that these will not be the last events we see in the course of the Trump administration. Activists leaving the Women’s March could be heard committing to renewed activism, and the Women’s March website has already been updated to suggest additional actions through a campaign of “10 Actions for the first 100 Days.” The website urges marchers to contact their elected officials on important issues and to build community groups of marchers and their supporters that can mobilize for change by working to influence government from the ground up.
These are the building blocks of moving expressions of discontent into political power. While it is too early to predict the exact outcomes of the Women’s March, there are already signs that these activists are engaging in additional forms of mobilization.
What we cannot yet know is whether that activism will manifest as community and state level mobilization or through the national parties. In any case, the Women’s March is more likely to be a beginning than an end.
Lee Ann Banaszak is a professor and head of the Department of Political Science in the Penn State College of Liberal Arts.


